My next-door PI wanted to look at the TRIM29 expression levels in a series of tumor xenografts from a microarray data. I used GEOquery bioconductor package to get the log2 transformed values and plot a boxplot for him. see the code below. Also, I had a previous post on GEOquery http://crazyhottommy.blogspot.com/2013/12/geoquery-to-access-geo-datasets.html
after got the Expression set object, I looked the names of the object:
> names(pData(gset))
[1] "title" "geo_accession" "status" "submission_date"
[5] "last_update_date" "type" "channel_count" "source_name_ch1"
[9] "organism_ch1" "characteristics_ch1" "biomaterial_provider_ch1" "molecule_ch1"
[13] "extract_protocol_ch1" "label_ch1" "label_protocol_ch1" "taxid_ch1"
[17] "source_name_ch2" "organism_ch2" "characteristics_ch2" "biomaterial_provider_ch2"
[21] "molecule_ch2" "extract_protocol_ch2" "label_ch2" "label_protocol_ch2"
[25] "taxid_ch2" "hyb_protocol" "scan_protocol" "description"
[29] "data_processing" "platform_id" "contact_name" "contact_email"
[33] "contact_phone" "contact_department" "contact_institute" "contact_address"
[37] "contact_city" "contact_state" "contact_zip/postal_code" "contact_country"
[41] "supplementary_file" "data_row_count"
then, only look at the meta data:
> pData(gset)[,c(1,2,28)]
title geo_accession description
GSM847887 ML-5998-TG1 GSM847887 Xenograft
GSM847888 Baylor 2147 TG6 GSM847888 Xenograft
GSM847890 Baylor 2665A TG6 GSM847890 Xenograft
GSM847891 Baylor 3107 TG5 GSM847891 Xenograft
GSM847892 Baylor 3143 TG5 GSM847892 Xenograft
GSM847893 Baylor 3204 TG5 GSM847893 Xenograft
GSM847894 Baylor 3561 TG5 GSM847894 Xenograft
GSM847895 Baylor 3611 TG5 GSM847895 Xenograft
GSM847896 Baylor 3613A TG5 GSM847896 Xenograft
GSM847898 Baylor 3807 TG5 GSM847898 Xenograft
GSM847901 Baylor 3887 TG5 GSM847901 Xenograft
GSM847902 Baylor 3904 TG5 GSM847902 Xenograft
GSM847903 Baylor 3936 TG5 GSM847903 Xenograft
GSM847904 Baylor 3963 TG5 GSM847904 Xenograft
GSM847905 Baylor 4013 TG1 GSM847905 Xenograft
GSM847907 Baylor 4175 TG1 GSM847907 Xenograft
GSM847908 Baylor 4195 TG4 GSM847908 Xenograft
GSM847909 Baylor 4272 TG1 GSM847909 Xenograft
GSM847911 Baylor 4664 TG1 GSM847911 Xenograft
GSM847914 Baylor 4888 TG1 GSM847914 Xenograft
GSM847915 Baylor 4913 TG1 GSM847915 Xenograft
GSM847917 ML-4189-TG2 GSM847917 Xenograft
GSM847919 ML-5097-TG2 GSM847919 Xenograft
GSM847920 ML-5156-TG2 GSM847920 Xenograft
GSM847921 ML-5471-TG2 GSM847921 Xenograft
GSM847922 9830-000060B NEW PROTOCOL V5 GSM847922 Tumor sample
GSM847923 9830-000094B-244K GSM847923 Tumor sample
GSM847924 9830-000424B-244Kv5 GSM847924 Tumor sample
GSM847925 9830-000517B-244Kv5 GSM847925 Tumor sample
GSM848100 9830-010118B NEW PROTOCOL V5 GSM848100 Tumor sample
GSM848101 9830-010130B NEW PROTOCOL V5 GSM848101 Tumor sample
GSM848102 9830-010214B NEW PROTOCOL V5 GSM848102 Tumor sample
GSM848103 9830-010255B NEW PROTOCOL V5 GSM848103 Tumor sample
GSM848104 9830-010384B NEW PROTOCOL V5 GSM848104 Tumor sample
GSM848105 9830-010461B-244Kv5 GSM848105 Tumor sample
GSM848106 9830-020018B-244K2008 GSM848106 Tumor sample
GSM848107 9830-020025B-244Kv5 GSM848107 Tumor sample
GSM848108 9830-020039B-244Kv5 GSM848108 Tumor sample
GSM848109 9830-020185B-244K2008 GSM848109 Tumor sample
GSM848110 9830-020310B-244Kv5 GSM848110 Tumor sample
GSM848111 9830-020340B NEW PROTOCOL V5 GSM848111 Tumor sample
GSM848112 9830-020416B NEW PROTOCOL V5 GSM848112 Tumor sample
GSM848113 9830-030267B-244K2008 GSM848113 Tumor sample
GSM848114 9830-030446B-244Kv5 GSM848114 Tumor sample
GSM848115 9830-030597B-244K2008 GSM848115 Tumor sample
GSM848116 UNC-000279B-244K2008 GSM848116 Tumor sample
GSM848117 UNC-010208B-244K2008 GSM848117 Tumor sample
GSM848118 UNC-010224B-244Kv5 GSM848118 Tumor sample
GSM848119 UNC-010304B-244Kv5 GSM848119 Tumor sample
GSM848120 UNC-010509B-244K2008 GSM848120 Tumor sample
GSM848121 UNC-020155B-244Kv5 GSM848121 Tumor sample
GSM848122 UNC-020320B-244K GSM848122 Tumor sample
GSM848123 UNC-020578B-244k-DGE GSM848123 Tumor sample
GSM848124 UNC-030065B-244K2008 GSM848124 Tumor sample
GSM848125 UNC-030183B-244K2008 GSM848125 Tumor sample
GSM848126 UNC-030370B-244K2008 GSM848126 Tumor sample
GSM848127 UNC-030528B-244K2008 GSM848127 Tumor sample
GSM848128 UNC-040011B-244K2008 GSM848128 Tumor sample
GSM848129 UNC-960028B-244Kv5 GSM848129 Tumor sample
GSM848130 WashU-15720-244Kv5 GSM848130 Tumor sample
there are 10 probes for TRIM29 gene:
> gpl_ann[gpl_ann$"Blast Gene Symbol"=="TRIM29",]
ID GB_ACC SPOT_ID Public id Probe NAME Blast Gene ID Blast Refseq ID Blast Gene Symbol
35972 35972 NM_012101 NM_012101 NM_012101_2_2683 23650 NM_012101.3 TRIM29
39854 39854 NM_012101 NM_012101 A_23_P340123 23650 NM_012101.3 TRIM29
76447 76447 NM_012101 NM_012101 A_23_P340123 23650 NM_012101.3 TRIM29
94361 94361 NM_012101 NM_012101 A_23_P203267 23650 NM_012101.3 TRIM29
97602 97602 NM_012101 NM_012101 NM_012101_2_2608 23650 NM_012101.3 TRIM29
111151 111151 NM_012101 NM_012101 NM_012101_2_2683 23650 NM_012101.3 TRIM29
120477 120477 NM_012101 NM_012101 A_23_P203260 23650 NM_012101.3 TRIM29
132274 132274 NM_012101 NM_012101 A_23_P203260 23650 NM_012101.3 TRIM29
187541 187541 NM_012101 NM_012101 NM_012101_2_2608 23650 NM_012101.3 TRIM29
190531 190531 NM_012101 NM_012101 A_23_P203267 23650 NM_012101.3 TRIM29
Blast Gene Description Blast Chromosome Map Location
35972 tripartite motif-containing 29 11q22-q23
39854 tripartite motif-containing 29 11q22-q23
76447 tripartite motif-containing 29 11q22-q23
94361 tripartite motif-containing 29 11q22-q23
97602 tripartite motif-containing 29 11q22-q23
111151 tripartite motif-containing 29 11q22-q23
120477 tripartite motif-containing 29 11q22-q23
132274 tripartite motif-containing 29 11q22-q23
187541 tripartite motif-containing 29 11q22-q23
190531 tripartite motif-containing 29 11q22-q23
the boxplot of the TRIM29 expression levels across different samples:
A wet-dry hybrid biologist's take on genetics and genomics. Mostly is about Linux, R, python, reproducible research, open science and NGS. Grab my book to transform yourself to a computational biologist https://divingintogeneticsandgenomics.ck.page/

This blog by Tommy Tang is licensed under a Creative Commons Attribution-ShareAlike 4.0 International License.
Friday, July 4, 2014
Thursday, June 26, 2014
quality control of your fastq file! my first post after I got my PhD!
I passed my defense on Tuesday, and now I am a PhD! what a long process, it took me six years. I've been enjoying the PhD experience though.
OK, let me go back to this post. things to remember:
1) You must quality control your fastq files first by fastqc. Trim the adapters and low quality bases by trimmomatic.
2) The fastq files dumped from the SRA GEO repository are usually the raw sequence, you need to quality control them.
3) google, google before you ask anyone else!
Let's start.
inspecting the first several reads of the fastq (this is a ChIP-seq data), I found the quality is coded as phred33
@SRR866627_nutlin_p53.1 HWI-ST571:161:D0YP4ACXX:3:1101:1437:2055 length=51
NCGAAAGACTGCTGGCCGACGTCGAGGTCCCGATTGTCGGCGTCGGCGGCA
+SRR866627_nutlin_p53.1 HWI-ST571:161:D0YP4ACXX:3:1101:1437:2055 length=51
#1:AABDDH<?CF<CFHH@D:??FAEE6?FHDAA=@CF@4@EBA88@;575
@SRR866627_nutlin_p53.2 HWI-ST571:161:D0YP4ACXX:3:1101:1423:2163 length=51
GAAATACTGTCTCTACTAAAAATACAAAAAGTAGCCAGGCGTCGTGGTGCA
+SRR866627_nutlin_p53.2 HWI-ST571:161:D0YP4ACXX:3:1101:1423:2163 length=51
B@CFFFFFHHHHGIJJJJIJJJIJJJJIJJIEGHIJJJJIJIIIHIE=FGC
To know different quality coding see here:
then I used fastqc to check the quality:
the quality for each base is very good, but the perbase sequence content does not look good, and the adapters are not trimmed as indicated by the overrepresented sequences (highlighted part is part of the Truseq adapter index1).
Then I used Trimmomatic to trim the adapters and the low quality bases.
$ trimmomatic SE in.fastq in_trimmed.fastq ILLUMINACLIP:Truseq_adaptor.fa:2:30:10 LEADING:3 TRAILING:3 SLIDINGWINDOW:4:15 MINLEN:36
the Truseq_adaptor.fa file contains the adapter sequences. see a post here.
$ cat Truseq_adaptor.fa
>TruSeq_Universal_Adapter
AATGATACGGCGACCACCGAGATCTACACTCTTTCCCTACACGACGCTCTTCCGATCT
>TruSeq_Adapter_Index_1
GATCGGAAGAGCACACGTCTGAACTCCAGTCACATCACGATCTCGTATGCCGTCTTCTGCTTG
>TruSeq_Adapter_Index_2
GATCGGAAGAGCACACGTCTGAACTCCAGTCACCGATGTATCTCGTATGCCGTCTTCTGCTTG
>TruSeq_Adapter_Index_3
GATCGGAAGAGCACACGTCTGAACTCCAGTCACTTAGGCATCTCGTATGCCGTCTTCTGCTTG
>TruSeq_Adapter_Index_4
GATCGGAAGAGCACACGTCTGAACTCCAGTCACTGACCAATCTCGTATGCCGTCTTCTGCTTG
>TruSeq_Adapter_Index_5
GATCGGAAGAGCACACGTCTGAACTCCAGTCACACAGTGATCTCGTATGCCGTCTTCTGCTTG
>TruSeq_Adapter_Index_6
GATCGGAAGAGCACACGTCTGAACTCCAGTCACGCCAATATCTCGTATGCCGTCTTCTGCTTG
>TruSeq_Adapter_Index_7
GATCGGAAGAGCACACGTCTGAACTCCAGTCACCAGATCATCTCGTATGCCGTCTTCTGCTTG
>TruSeq_Adapter_Index_8
GATCGGAAGAGCACACGTCTGAACTCCAGTCACACTTGAATCTCGTATGCCGTCTTCTGCTTG
>TruSeq_Adapter_Index_9
GATCGGAAGAGCACACGTCTGAACTCCAGTCACGATCAGATCTCGTATGCCGTCTTCTGCTTG
>TruSeq_Adapter_Index_10
GATCGGAAGAGCACACGTCTGAACTCCAGTCACTAGCTTATCTCGTATGCCGTCTTCTGCTTG
>TruSeq_Adapter_Index_11
GATCGGAAGAGCACACGTCTGAACTCCAGTCACGGCTACATCTCGTATGCCGTCTTCTGCTTG
>TruSeq_Adapter_Index_12
GATCGGAAGAGCACACGTCTGAACTCCAGTCACCTTGTAATCTCGTATGCCGTCTTCTGCTTG
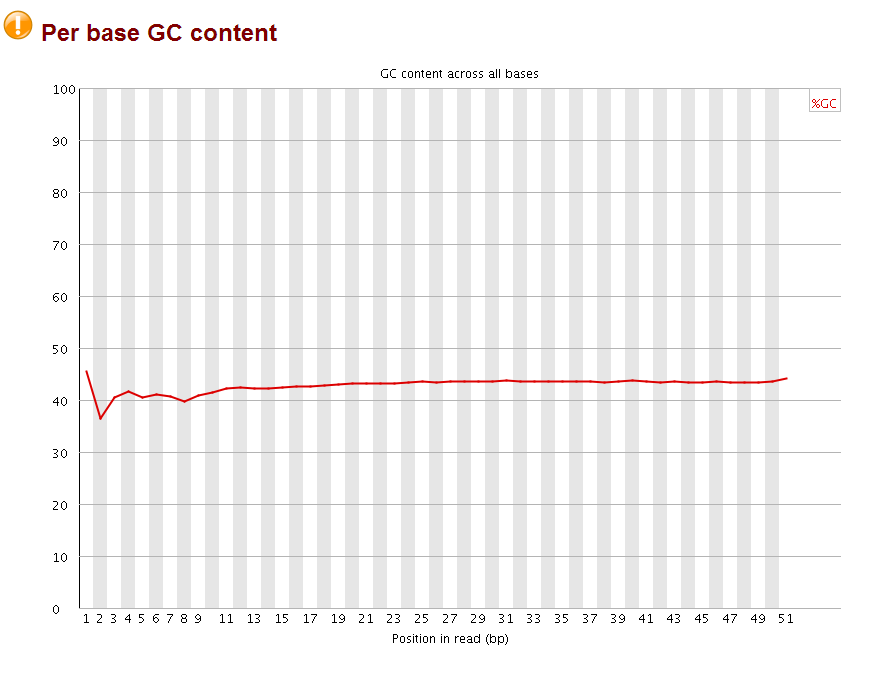
after that, I checked the with fastqc again:
The perbase quality was improved and the per base GC content became more normal (should be 25% percent for each A,T,C,G base, it looks like the sequences are more A/T rich). More importantly, no overrepresent sequences were found anymore. Now the fastq file is ready for subsequent mapping by bowtie.
sometime ago, I quality controlled a RNA-seq data, and found found many wired things and asked on biostar.
Take home messages:
1)
"The weird per-base content is extremely normal and is typically referred to as the "random" hexamer effect, since things aren't actually amplified in a uniform manner. Most people will have this and it's nothing to worry about. BTW, don't let anyone talk you into trimming that off, it's the legitimate sequence."
2)
"Duplicates are expected in RNAseq. Firstly, your samples are probably full of rRNAs, even if you performed ribodepletion. Secondly, any highly expressed gene is going to have apparent PCR duplication due solely to it being highly expressed (there is a ceiling on the coverage you can get before running into this, it's pretty high with paired-end reads but not infinite)."
3)Several posts for whether the duplicates need to be removed or not.
https://www.biostars.org/p/55648/
https://www.biostars.org/p/66831/
https://www.biostars.org/p/14283/
Currently, I do not remove them. That's all for today!
OK, let me go back to this post. things to remember:
1) You must quality control your fastq files first by fastqc. Trim the adapters and low quality bases by trimmomatic.
2) The fastq files dumped from the SRA GEO repository are usually the raw sequence, you need to quality control them.
3) google, google before you ask anyone else!
Let's start.
inspecting the first several reads of the fastq (this is a ChIP-seq data), I found the quality is coded as phred33
@SRR866627_nutlin_p53.1 HWI-ST571:161:D0YP4ACXX:3:1101:1437:2055 length=51
NCGAAAGACTGCTGGCCGACGTCGAGGTCCCGATTGTCGGCGTCGGCGGCA
+SRR866627_nutlin_p53.1 HWI-ST571:161:D0YP4ACXX:3:1101:1437:2055 length=51
#1:AABDDH<?CF<CFHH@D:??FAEE6?FHDAA=@CF@4@EBA88@;575
@SRR866627_nutlin_p53.2 HWI-ST571:161:D0YP4ACXX:3:1101:1423:2163 length=51
GAAATACTGTCTCTACTAAAAATACAAAAAGTAGCCAGGCGTCGTGGTGCA
+SRR866627_nutlin_p53.2 HWI-ST571:161:D0YP4ACXX:3:1101:1423:2163 length=51
B@CFFFFFHHHHGIJJJJIJJJIJJJJIJJIEGHIJJJJIJIIIHIE=FGC
SSSSSSSSSSSSSSSSSSSSSSSSSSSSSSSSSSSSSSSSS..................................................... ..........................XXXXXXXXXXXXXXXXXXXXXXXXXXXXXXXXXXXXXXXXXXXXXX...................... ...............................IIIIIIIIIIIIIIIIIIIIIIIIIIIIIIIIIIIIIIIII...................... .................................JJJJJJJJJJJJJJJJJJJJJJJJJJJJJJJJJJJJJJJ...................... LLLLLLLLLLLLLLLLLLLLLLLLLLLLLLLLLLLLLLLLLL.................................................... !"#$%&'()*+,-./0123456789:;<=>?@ABCDEFGHIJKLMNOPQRSTUVWXYZ[\]^_`abcdefghijklmnopqrstuvwxyz{|}~ | | | | | | 33 59 64 73 104 126 0........................26...31.......40 -5....0........9.............................40 0........9.............................40 3.....9.............................40 0.2......................26...31.........41 S - Sanger Phred+33, raw reads typically (0, 40) X - Solexa Solexa+64, raw reads typically (-5, 40) I - Illumina 1.3+ Phred+64, raw reads typically (0, 40) J - Illumina 1.5+ Phred+64, raw reads typically (3, 40) with 0=unused, 1=unused, 2=Read Segment Quality Control Indicator (bold) (Note: See discussion above). L - Illumina 1.8+ Phred+33, raw reads typically (0, 41)
then I used fastqc to check the quality:
the quality for each base is very good, but the perbase sequence content does not look good, and the adapters are not trimmed as indicated by the overrepresented sequences (highlighted part is part of the Truseq adapter index1).
Then I used Trimmomatic to trim the adapters and the low quality bases.
$ trimmomatic SE in.fastq in_trimmed.fastq ILLUMINACLIP:Truseq_adaptor.fa:2:30:10 LEADING:3 TRAILING:3 SLIDINGWINDOW:4:15 MINLEN:36
$ cat Truseq_adaptor.fa
>TruSeq_Universal_Adapter
AATGATACGGCGACCACCGAGATCTACACTCTTTCCCTACACGACGCTCTTCCGATCT
>TruSeq_Adapter_Index_1
GATCGGAAGAGCACACGTCTGAACTCCAGTCACATCACGATCTCGTATGCCGTCTTCTGCTTG
>TruSeq_Adapter_Index_2
GATCGGAAGAGCACACGTCTGAACTCCAGTCACCGATGTATCTCGTATGCCGTCTTCTGCTTG
>TruSeq_Adapter_Index_3
GATCGGAAGAGCACACGTCTGAACTCCAGTCACTTAGGCATCTCGTATGCCGTCTTCTGCTTG
>TruSeq_Adapter_Index_4
GATCGGAAGAGCACACGTCTGAACTCCAGTCACTGACCAATCTCGTATGCCGTCTTCTGCTTG
>TruSeq_Adapter_Index_5
GATCGGAAGAGCACACGTCTGAACTCCAGTCACACAGTGATCTCGTATGCCGTCTTCTGCTTG
>TruSeq_Adapter_Index_6
GATCGGAAGAGCACACGTCTGAACTCCAGTCACGCCAATATCTCGTATGCCGTCTTCTGCTTG
>TruSeq_Adapter_Index_7
GATCGGAAGAGCACACGTCTGAACTCCAGTCACCAGATCATCTCGTATGCCGTCTTCTGCTTG
>TruSeq_Adapter_Index_8
GATCGGAAGAGCACACGTCTGAACTCCAGTCACACTTGAATCTCGTATGCCGTCTTCTGCTTG
>TruSeq_Adapter_Index_9
GATCGGAAGAGCACACGTCTGAACTCCAGTCACGATCAGATCTCGTATGCCGTCTTCTGCTTG
>TruSeq_Adapter_Index_10
GATCGGAAGAGCACACGTCTGAACTCCAGTCACTAGCTTATCTCGTATGCCGTCTTCTGCTTG
>TruSeq_Adapter_Index_11
GATCGGAAGAGCACACGTCTGAACTCCAGTCACGGCTACATCTCGTATGCCGTCTTCTGCTTG
>TruSeq_Adapter_Index_12
GATCGGAAGAGCACACGTCTGAACTCCAGTCACCTTGTAATCTCGTATGCCGTCTTCTGCTTG
after that, I checked the with fastqc again:
The perbase quality was improved and the per base GC content became more normal (should be 25% percent for each A,T,C,G base, it looks like the sequences are more A/T rich). More importantly, no overrepresent sequences were found anymore. Now the fastq file is ready for subsequent mapping by bowtie.
sometime ago, I quality controlled a RNA-seq data, and found found many wired things and asked on biostar.
Take home messages:
1)
"The weird per-base content is extremely normal and is typically referred to as the "random" hexamer effect, since things aren't actually amplified in a uniform manner. Most people will have this and it's nothing to worry about. BTW, don't let anyone talk you into trimming that off, it's the legitimate sequence."
2)
"Duplicates are expected in RNAseq. Firstly, your samples are probably full of rRNAs, even if you performed ribodepletion. Secondly, any highly expressed gene is going to have apparent PCR duplication due solely to it being highly expressed (there is a ceiling on the coverage you can get before running into this, it's pretty high with paired-end reads but not infinite)."
3)Several posts for whether the duplicates need to be removed or not.
https://www.biostars.org/p/55648/
https://www.biostars.org/p/66831/
https://www.biostars.org/p/14283/
Currently, I do not remove them. That's all for today!
Tuesday, June 17, 2014
& or && operator in R
I will defend next Tuesday. To relieve my anxiety a little bit, I decide to blog a little bit.
I am confused about the operator & and && in R, which one should I use?
It turns out:
"The shorter ones are vectorized, meaning they can return a vector, The longer form evaluates left to right examining only the first element of each vector"
an example would suffice to explain it.
> x<-c(1:10)
> x
[1] 1 2 3 4 5 6 7 8 9 10
> x>8
[1] FALSE FALSE FALSE FALSE FALSE FALSE FALSE FALSE TRUE TRUE
> logical1<- x>8
> logical2<- x<5
> logical1
[1] FALSE FALSE FALSE FALSE FALSE FALSE FALSE FALSE TRUE TRUE
> logical2
[1] TRUE TRUE TRUE TRUE FALSE FALSE FALSE FALSE FALSE FALSE
> logical1 | logical2
[1] TRUE TRUE TRUE TRUE FALSE FALSE FALSE FALSE TRUE TRUE
> logical1 & logical2
[1] FALSE FALSE FALSE FALSE FALSE FALSE FALSE FALSE FALSE FALSE
> logical1 && logical2
[1] FALSE
one can subset the vector by the logical vectors:
> x[logical1]
[1] 9 10
> x[logical2]
[1] 1 2 3 4
I am confused about the operator & and && in R, which one should I use?
It turns out:
"The shorter ones are vectorized, meaning they can return a vector, The longer form evaluates left to right examining only the first element of each vector"
an example would suffice to explain it.
> x<-c(1:10)
> x
[1] 1 2 3 4 5 6 7 8 9 10
> x>8
[1] FALSE FALSE FALSE FALSE FALSE FALSE FALSE FALSE TRUE TRUE
> logical1<- x>8
> logical2<- x<5
> logical1
[1] FALSE FALSE FALSE FALSE FALSE FALSE FALSE FALSE TRUE TRUE
> logical2
[1] TRUE TRUE TRUE TRUE FALSE FALSE FALSE FALSE FALSE FALSE
> logical1 | logical2
[1] TRUE TRUE TRUE TRUE FALSE FALSE FALSE FALSE TRUE TRUE
> logical1 & logical2
[1] FALSE FALSE FALSE FALSE FALSE FALSE FALSE FALSE FALSE FALSE
> logical1 && logical2
[1] FALSE
one can subset the vector by the logical vectors:
> x[logical1]
[1] 9 10
> x[logical2]
[1] 1 2 3 4
Tuesday, May 27, 2014
MACS for Dnase-seq data
It has been a long time since I posted last time. I will be defending at the end of next month. So, I am busy with my thesis writing. Anyway, I do want to keep a note here for using MACS to identify Dnase-seq peaks.
Although MACS was developed for ChIP-seq. It can also be used for Dnase-seq data. see a discussion here:
https://groups.google.com/forum/#!topic/macs-announcement/D1ZlzIJMBB8
several responses from the author of MACS Tao Liu:
Hi Zoello and Batool,
please read the related papers also:
Although MACS was developed for ChIP-seq. It can also be used for Dnase-seq data. see a discussion here:
https://groups.google.com/forum/#!topic/macs-announcement/D1ZlzIJMBB8
several responses from the author of MACS Tao Liu:
Hi Zoello and Batool,
Any extension size is better than no extension at all. Even if there is no meaningful fragment size, signal pileup and data smoothing are still essential for peak detection algorithm. If you consider every tag only represents 0bp fragment, how can you decide where the enrichment is?
As for DNAseI hypersensitive studies, there are two scenarios. Using human ENCODE data as example, data from Duke university and University of Washington are generated by two different protocols. The key difference is the depth of digestion. DNA fragment captured is smaller in UW library comparing to Duke library due to different levels of digestion. In UW library, deep digestion and a gel cut for more smaller fragments can make sure the sequencing ends enriched at the boundaries of regions where the DNA is less accessible by the enzyme. These regions are more likely protected from DNaseI because of protein (TF, histone or other chromatin factors) binding in nuclei. So the following analysis can be considered similar to ChIP-seq where sonication tends to attack the boundaries of TF binding sites. In this case, tag extension towards 3' direction with hundreds of basepairs either from MACS prediction or an arbitrary setting, would work perfect. You can simply apply MACS on this kind of data. At the end, you will more likely predict where the DNA footprints are. However the sequencing tags from Duke are ends of bigger DNA fragments. So tag extension towards 3' direction may less likely reach where the real footprint is. In this case, the aim of the study should be to look for where the DNAseI hypersensitive sites are instead of to find footprints. My opinion is to extend every tag towards both 5' and 3' directions then pile them up, therefore at the end, the regions with more pileup would be more vulnerable to DNAseI digestion. If you want to use MACS for this purpose, you may need to manipulate the raw data then turn off model building in MACS.
That's my point of view. If anyone has difference opinion, please let us know."
"Of course you can use MACS2 on DNAse-seq data analysis. As for Hotspot, it uses a 250bps sliding window for calculation tag enrichment which is equivalent to a fixed 250bps extension in MACS2 setting. As for number of peaks, it mainly depends on cutoff. Although DHS sites range from narrow to broad, there may still be an intrinsic fragment size in the library -- check your _model.pdf file from MACS2 or try Anshul's PhantomPeak tool. After all, this 'fragment size' is a factor for smoothing method, and an approximately correct smoothing is enough to improve peak detection. You may also try other methods without data smoothing, for example, SPP from Peter Park's lab or GPS from David Gifford's lab which can detect regions mainly based on forward and reverse reads balancing."
please read the related papers also:
Refined DNase-seq protocol and data analysis reveals intrinsic bias in transcription factor footprint identification
http://www.nature.com/nmeth/journal/v11/n1/full/nmeth.2762.html
Current bioinformatic approaches to identify DNase I hypersensitive sites and genomic footprints from DNase-seq data
http://www.ncbi.nlm.nih.gov/pmc/articles/PMC3484326/
A Comparison of Peak Callers Used for DNase-Seq Data
http://www.plosone.org/article/info%3Adoi%2F10.1371%2Fjournal.pone.0096303
and a discussion on biostar
https://www.biostars.org/p/70087/
Monday, April 14, 2014
order a matrix by a pre-defined group and then by the rowSums in R
I will lay down the R code below
#create a matrix
> mat<- matrix(sample.int(10, size=30, replace=T), ncol=3)
> mat
[,1] [,2] [,3]
[1,] 4 7 6
[2,] 5 6 1
[3,] 4 3 1
[4,] 2 2 9
[5,] 4 5 4
[6,] 8 9 8
[7,] 5 9 7
[8,] 8 6 7
[9,] 3 8 5
[10,] 4 3 6
# column bind the mat and the sum of the rows together
> mat1<- cbind(mat, rowSums(mat))
> mat1
[,1] [,2] [,3] [,4]
[1,] 4 7 6 17
[2,] 5 6 1 12
[3,] 4 3 1 8
[4,] 2 2 9 13
[5,] 4 5 4 13
[6,] 8 9 8 25
[7,] 5 9 7 21
[8,] 8 6 7 21
[9,] 3 8 5 16
[10,] 4 3 6 13
# order the matrix by the rowSums(mat)
> mat[order(rowSums(mat)),]
[,1] [,2] [,3]
[1,] 4 3 1
[2,] 5 6 1
[3,] 2 2 9
[4,] 4 5 4
[5,] 4 3 6
[6,] 3 8 5
[7,] 4 7 6
[8,] 5 9 7
[9,] 8 6 7
[10,] 8 9 8
# compare with the order by looking at the last column
> mat1[order(rowSums(mat)),]
[,1] [,2] [,3] [,4]
[1,] 4 3 1 8
[2,] 5 6 1 12
[3,] 2 2 9 13
[4,] 4 5 4 13
[5,] 4 3 6 13
[6,] 3 8 5 16
[7,] 4 7 6 17
[8,] 5 9 7 21
[9,] 8 6 7 21
[10,] 8 9 8 25
# order the mat matrix in a decreasing order by adding a minus sign
> mat[order(-rowSums(mat)),]
[,1] [,2] [,3]
[1,] 8 9 8
[2,] 5 9 7
[3,] 8 6 7
[4,] 4 7 6
[5,] 3 8 5
[6,] 2 2 9
[7,] 4 5 4
[8,] 4 3 6
[9,] 5 6 1
[10,] 4 3 1
# label the rows into different groups
> rownames(mat)<- c("f","a","d","c","b","d","e","a","f","f")
> mat
[,1] [,2] [,3]
f 4 7 6
a 5 6 1
d 4 3 1
c 2 2 9
b 4 5 4
d 8 9 8
e 5 9 7
a 8 6 7
f 3 8 5
f 4 3 6
> rownames(mat1)<- c("f","a","d","c","b","d","e","a","f","f")
> mat1
[,1] [,2] [,3] [,4]
f 4 7 6 17
a 5 6 1 12
d 4 3 1 8
c 2 2 9 13
b 4 5 4 13
d 8 9 8 25
e 5 9 7 21
a 8 6 7 21
f 3 8 5 16
f 4 3 6 13
> groups<- factor(rownames(mat))
> groups
[1] f a d c b d e a f f
Levels: a b c d e f
# order the matrix by group first, and then within the subgroups, order by the rowSums
> mat1[order(groups,rowSums(mat)),]
[,1] [,2] [,3] [,4]
a 5 6 1 12
a 8 6 7 21
b 4 5 4 13
c 2 2 9 13
d 4 3 1 8
d 8 9 8 25
e 5 9 7 21
f 4 3 6 13
f 3 8 5 16
f 4 7 6 17
It is extremely useful when I want to order the matrix by a pre-defined way and then plot the heatmap with heatmap2 in gplots package.
Friday, April 11, 2014
rehead a bam file
I downloaded some ChIP-seq bam files from the UCSC genome browser http://hgdownload.cse.ucsc.edu/goldenPath/hg19/encodeDCC/wgEncodeHaibTfbs/
and I found some bam files headers are without chrY information
samtools view -H my.sorted.bam
@SQ SN:chr1 LN:249250621
@SQ SN:chr2 LN:243199373
@SQ SN:chr3 LN:198022430
@SQ SN:chr4 LN:191154276
@SQ SN:chr5 LN:180915260
@SQ SN:chr6 LN:171115067
@SQ SN:chr7 LN:159138663
@SQ SN:chr8 LN:146364022
@SQ SN:chr9 LN:141213431
@SQ SN:chr10 LN:135534747
@SQ SN:chr11 LN:135006516
@SQ SN:chr12 LN:133851895
@SQ SN:chr13 LN:115169878
@SQ SN:chr14 LN:107349540
@SQ SN:chr15 LN:102531392
@SQ SN:chr16 LN:90354753
@SQ SN:chr17 LN:81195210
@SQ SN:chr18 LN:78077248
@SQ SN:chr19 LN:59128983
@SQ SN:chr20 LN:63025520
@SQ SN:chr21 LN:48129895
@SQ SN:chr22 LN:51304566
@SQ SN:chrX LN:155270560
@SQ SN:chrM LN:16571
and I found some bam files headers are without chrY information
samtools view -H my.sorted.bam
@SQ SN:chr1 LN:249250621
@SQ SN:chr2 LN:243199373
@SQ SN:chr3 LN:198022430
@SQ SN:chr4 LN:191154276
@SQ SN:chr5 LN:180915260
@SQ SN:chr6 LN:171115067
@SQ SN:chr7 LN:159138663
@SQ SN:chr8 LN:146364022
@SQ SN:chr9 LN:141213431
@SQ SN:chr10 LN:135534747
@SQ SN:chr11 LN:135006516
@SQ SN:chr12 LN:133851895
@SQ SN:chr13 LN:115169878
@SQ SN:chr14 LN:107349540
@SQ SN:chr15 LN:102531392
@SQ SN:chr16 LN:90354753
@SQ SN:chr17 LN:81195210
@SQ SN:chr18 LN:78077248
@SQ SN:chr19 LN:59128983
@SQ SN:chr20 LN:63025520
@SQ SN:chr21 LN:48129895
@SQ SN:chr22 LN:51304566
@SQ SN:chrX LN:155270560
@SQ SN:chrM LN:16571
for some downstream analysis, I have to rehead this bam file:
samtools view -H my.bam | sed '24 a @SQ SN:chrY LN:59373566' | samtools reheader - my.bam > my.reheaded.bam
sed to append a line "@SQ SN:chrY LN:59373566" at the 24th line
ctr+v+tab to insert a tab in the terminal.
Friday, April 4, 2014
liftover wig file
I was looking at a public ChIP-seq data set, but the author did not put the raw sequence data in the GEO database. Instead, they uploaded a wig file of the ChIP-seq signal file and it was mapped to human hg18 reference genome.
All the other data sets I am analyzing are mapped to hg19, so I have to liftover this wig file to hg19 also.
Solution: CrossMap! http://crossmap.sourceforge.net/
It is very easy to use, after install it following the instruction I did:
CrossMap.py wig hg18ToHg19.over.chain.gz my.wig my_hg19
it generates a bigwig file, a sorted bedgraph and a unsorted bedgraph file.
it took me 36mins to convert a 1.4Gb wig file on my desktop with 4Gb ram.
All the other data sets I am analyzing are mapped to hg19, so I have to liftover this wig file to hg19 also.
Solution: CrossMap! http://crossmap.sourceforge.net/
Convert Wiggle/BigWig format files
Wiggle (WIG) format is useful for displaying continuous data such as GC content and reads intensity of high-throughput sequencing data. BigWig is a self-indexed binary-format Wiggle file, and has the advantage of supporting random access. This means only regions that need to be displayed are retrieved by genome browser, and it dramatically reduces the time needed for data transferring (Kent et al., 2010). Input wiggle data can be in variableStep (for data with irregular intervals) or fixedStep (for data with regular intervals). Regardless of the input, the output will always in bedGraph format. bedGraph format is similar to wiggle format and can be converted into BigWig format using UCSC wigToBigWig tool. We export files in bedGraph because it is usually much smaller than file in wiggle format, and more importantly, CrossMap internally transforms wiggle into bedGraph to increase running speed.
If an input file is in BigWig format, the output is BigWig format if UCSC’s ‘wigToBigWig‘ executable can be found; otherwise, the output file will be in bedGraph format.
Typing command without any arguments will print help message:
$ python2.7 CrossMap.py wig
Screen output:
Usage:
CrossMap.py wig input_chain_file input_wig_file output_prefix
Description:
"input_chain_file" can be regular or compressed (*.gz, *.Z, *.z, *.bz, *.bz2,
*.bzip2) file, local file or URL (http://, https://, ftp://) pointing to remote
file. Both "variableStep" and "fixedStep" wiggle lines are supported. Wiggle
format: http://genome.ucsc.edu/goldenPath/help/wiggle.html
Example:
CrossMapy.py wig hg18ToHg19.over.chain.gz test.hg18.wig test.hg19
It is very easy to use, after install it following the instruction I did:
CrossMap.py wig hg18ToHg19.over.chain.gz my.wig my_hg19
it generates a bigwig file, a sorted bedgraph and a unsorted bedgraph file.
it took me 36mins to convert a 1.4Gb wig file on my desktop with 4Gb ram.
Tuesday, March 18, 2014
qseq to fastq conversion
I was looking at some old ChIP-seq data with raw file in qseq format. I want to convert them to fastq file for mapping with bowtie.
A quick google I found:
http://www.biostars.org/p/6682/
the qseqtofastq C++ program http://www.dna.bio.keio.ac.jp/~krisp/qseq2fastq/ has to be compiled by scons, and I encountered some compiling problem. I gave it up and used this java program http://sourceforge.net/projects/snpeff/files/qseq2fastq.jar/download
Usage:
zcat myfile.qseq.tgz | java -jar qseqtofastq.jar -phred64 > myfile.fastq
it took me around 1 hour to finish the conversion of a 600MB tgz file on the computing cluster (single cpu 4GB ram).
I did have a problem at the end:
Exception in thread "main" java.lang.RuntimeException: java.lang.ArrayIndexOutOfBoundsException: 8
at ca.mcgill.mcb.pcingola.Qseq2Fastq.main(Qseq2Fastq.java:51)
Caused by: java.lang.ArrayIndexOutOfBoundsException: 8
at ca.mcgill.mcb.pcingola.Qseq2Fastq.main(Qseq2Fastq.java:43)
I counted the lines of the fastq file (divided by 4) and the original qseq file , and they are equal. So, I went ahead and mapped the fastq file with bowtie.
A quick google I found:
http://www.biostars.org/p/6682/
the qseqtofastq C++ program http://www.dna.bio.keio.ac.jp/~krisp/qseq2fastq/ has to be compiled by scons, and I encountered some compiling problem. I gave it up and used this java program http://sourceforge.net/projects/snpeff/files/qseq2fastq.jar/download
Usage:
zcat myfile.qseq.tgz | java -jar qseqtofastq.jar -phred64 > myfile.fastq
it took me around 1 hour to finish the conversion of a 600MB tgz file on the computing cluster (single cpu 4GB ram).
I did have a problem at the end:
Exception in thread "main" java.lang.RuntimeException: java.lang.ArrayIndexOutOfBoundsException: 8
at ca.mcgill.mcb.pcingola.Qseq2Fastq.main(Qseq2Fastq.java:51)
Caused by: java.lang.ArrayIndexOutOfBoundsException: 8
at ca.mcgill.mcb.pcingola.Qseq2Fastq.main(Qseq2Fastq.java:43)
I counted the lines of the fastq file (divided by 4) and the original qseq file , and they are equal. So, I went ahead and mapped the fastq file with bowtie.
Wednesday, March 12, 2014
Several NGS bioinformatics training materials
1. Next Generation sequencing wiki book http://en.wikibooks.org/wiki/Next_Generation_Sequencing_(NGS)
2. UCDavis training course https://training.bioinformatics.ucdavis.edu/documentation/
3. MSU training course by Titus Brown http://ged.msu.edu/angus/index.html
4. GOBLET http://www.mygoblet.org/training-portal
5. more http://ged.msu.edu/angus/bioinformatics-courses.html
6. a list maintained by Stephen Turner in UVA http://stephenturner.us/edu.html
7. GVL practial protocols for ChIP-seq, RNA-seq, variant calling etc https://genome.edu.au/wiki/GVL
These will keep me busy for a while...I feel I do not have enough time to learn :)
2. UCDavis training course https://training.bioinformatics.ucdavis.edu/documentation/
3. MSU training course by Titus Brown http://ged.msu.edu/angus/index.html
4. GOBLET http://www.mygoblet.org/training-portal
5. more http://ged.msu.edu/angus/bioinformatics-courses.html
6. a list maintained by Stephen Turner in UVA http://stephenturner.us/edu.html
7. GVL practial protocols for ChIP-seq, RNA-seq, variant calling etc https://genome.edu.au/wiki/GVL
These will keep me busy for a while...I feel I do not have enough time to learn :)
Monday, March 3, 2014
Unix sort except the first line
Many times I have a file with a header needs to be sorted, but I do not want to sort the header.
I saw it on Twitter:
REPLY is the default variable for the read command.
one more general use of the "body" function
http://stackoverflow.com/questions/9281449/unix-skip-header-bash-function
http://unix.stackexchange.com/questions/11856/sort-but-keep-header-line-in-the-at-the-top
Or an awk solution awk 'NR == 1; NR > 1 {print $0 | "sort -n"}'
It is very handy to use.
Test:
tommy@tommy-ThinkPad-T420:~$ cat body_sort.txt
header
4
6
9
7
14
8
I saw it on Twitter:
Retweeted by Ming Tang
todays fav linux oneliner:
command | (read -r; printf "%s\n" "$REPLY"; sort) > output
sort everything except first line.
REPLY is the default variable for the read command.
one more general use of the "body" function
http://stackoverflow.com/questions/9281449/unix-skip-header-bash-function
http://unix.stackexchange.com/questions/11856/sort-but-keep-header-line-in-the-at-the-top
# print the header (the first line of input)
# and then run the specified command on the body (the rest of the input)
# use it in a pipeline, e.g. ps | body grep somepattern
body() {
IFS= read -r header
printf '%s\n' "$header"
"$@"
}
IFS is the bash Shell Bourne variable: A list of characters that separate fields used by the shell to split text strings.$# Stores the number of command-line arguments that
were passed to the shell program.
$? Stores the exit value of the last command that was
executed.
$0 Stores the first word of the entered command (the
name of the shell program).
$* Stores all the arguments that were entered on the
command line ($1 $2 ...).
"$@" Stores all the arguments that were entered
on the command line, individually quoted ("$1" "$2" ...).
Or an awk solution awk 'NR == 1; NR > 1 {print $0 | "sort -n"}'
It is very handy to use.
Test:
tommy@tommy-ThinkPad-T420:~$ cat body_sort.txt
header
4
6
9
7
14
8
tommy@tommy-ThinkPad-T420:~$ cat body_sort.txt |( read -r; printf "%s\n" "$REPLY"; sort -n)
header
4
6
7
8
9
14
Subscribe to:
Posts (Atom)

razor